| : : |
Comparison of MIPS physical interaction data and MIPS genetic interaction data |
|
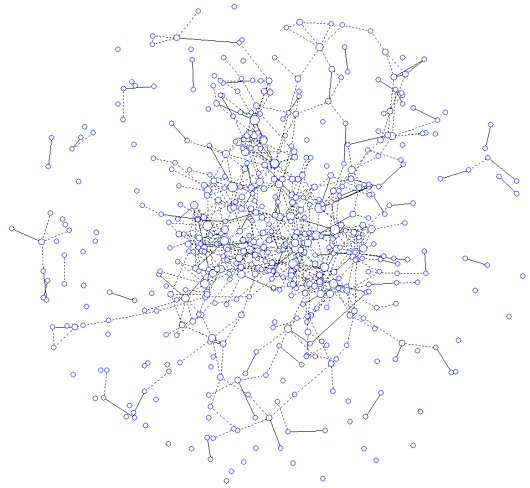
Node: 471, Edge 600
This network represents proteins and their interactions shared by MIPS physical interaction data and MIPS genetic interaction data. A solid line represents an interaction shared by the two data, and a dotted line represents an interaction present in one data only.
|
|
| : : |
Coloring -- another way of finding a network common to multiple networks |
|
Human interaction data (part of the entire human protein interaction data)
result of coloring
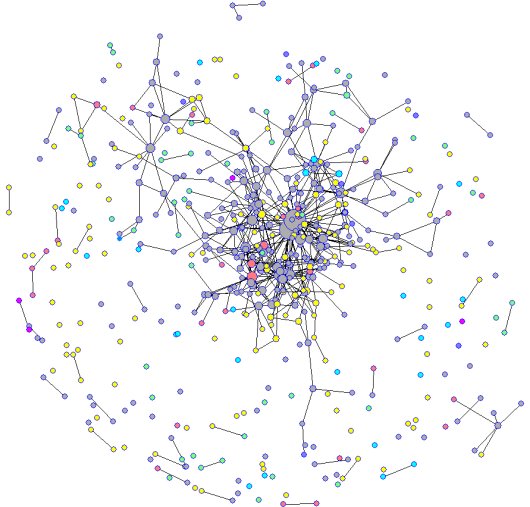
Three original networks, each represented in cyan, yellow and magenta are compared. Proteins common to the networks are represented in mixed color.
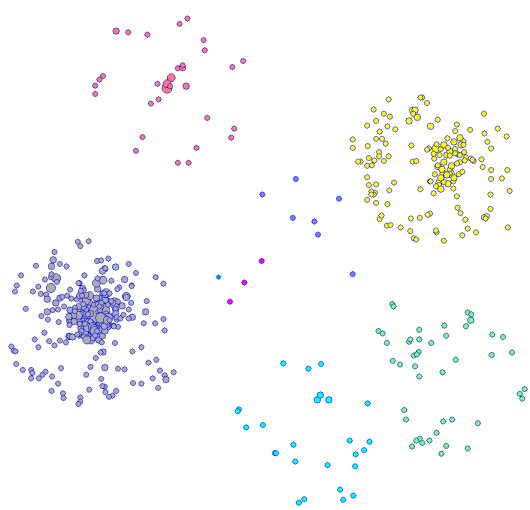
Separated graphs by color from the above network. Edges are not shown.
|
